
Numbers that tell you what to do tomorrow
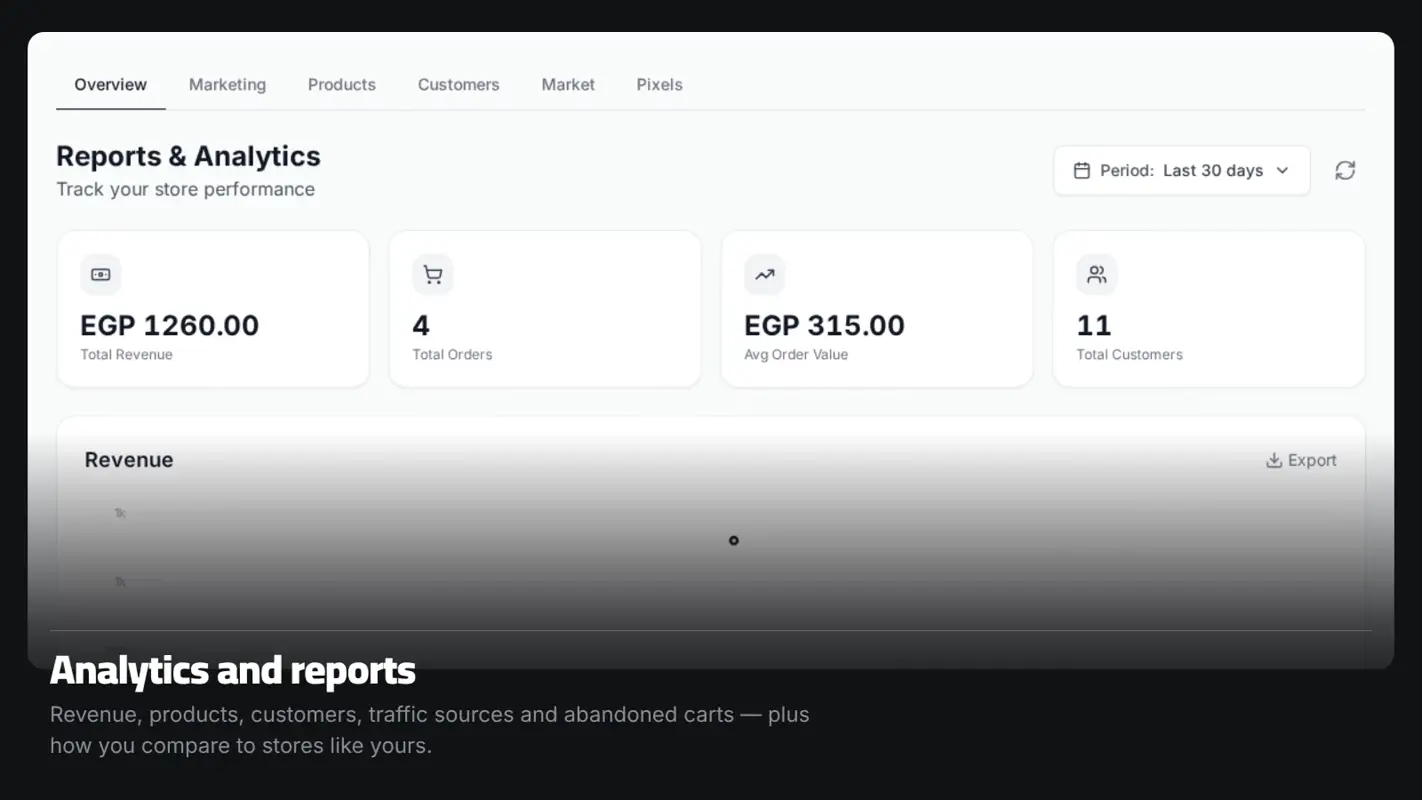
Reports aren't a wall of colour to admire. They earn their place by answering specific questions: is revenue up or down, which product is pulling and which is stalled, and whether that cash-on-delivery money is still with the courier or has actually reached you. On paid plans they also answer where the visitor drops out on the way to paying, and who came back and bought again. All of it is computed from your orders and your store's traffic, with nothing to install.
What it actually does
Revenue over time
A revenue curve, order counts and average order value across the period you choose, with revenue split by payment method. Revenue counts only orders that were actually paid and subtracts what was refunded, so the figure isn't inflated.
Cash-on-delivery money
Three figures that separate something most platforms blur together: how much is still awaiting collection, how much was collected and is on its way to you, and how much has actually landed. The gap between the second and the third is your money that is not yet in your hands.
Products
Best sellers up to fifty products, ranked by revenue or by quantity, plus a list of the products most often left in a basket and never bought. On paid plans, each product also gets a trend view showing its performance over time.
Customers and whether they return
New against returning, and average customer lifetime value. On paid plans, a retention table groups customers by the month of their first order and shows how many came back after one, two, three and six months — the table that tells you whether you are gaining customers or renting them.
Visits and where they come from
Visitors, page views and conversion rate, and where people arrived from, broken down by the sites that sent them. Most-viewed products with their view-to-basket conversion, and the terms visitors searched for inside your store — which tells you something you won't learn anywhere else: what people are looking for on your store and not finding.
Abandoned baskets
How many baskets were abandoned and what they were worth, how many later turned into an order, and the recovery rate — along with the products most often abandoned.
Compared to stores like yours
Your figures against the median for stores in your line of work and size, across ten measures including average order value, repeat-customer rate, cancellation rate, cash-on-delivery share and delivery success rate. Fully anonymised, and it needs enough comparable stores before it will show.
How it works
Sell
There's nothing to install. Every order and every visit is recorded on its own.
Open analytics
Dashboard → Analytics: overview, marketing, products, customers, comparison, and ad pixels.
Set the period
Today, the last seven days, or the last thirty.
Go deeper
From the summary into a single product, into traffic sources, or — on paid plans — into the retention table.
Who this is for
- Any merchant spending on ads who needs to know whether the money is coming back.
- Stores with a large catalogue that need to know which products deserve more stock.
- Stores working on cash on delivery that need to know exactly where their money is.
- Anyone seeing plenty of traffic and few orders who wants to know where people drop out.
Common questions
Are the figures real-time?
Not to the second. Results are cached briefly (about 5 minutes) so pages open fast, which means an order placed right now may take a few minutes to appear.
Why is revenue different from the sum of my orders?
Because revenue counts only paid orders — prepaid, collected on delivery, or settled — and subtracts what was refunded. An order that hasn't been paid, or was cancelled, is not counted as revenue.
Can I pick a custom date range?
Not yet. The available periods are today, the last seven days and the last thirty; the comparison screen has thirty and ninety days.
Can I download the reports as a file?
The customer list can be downloaded as a file from the Customers screen. Downloading revenue and order reports from the analytics screen isn't working yet, and we're fixing it.
Do I need Google Analytics?
Not necessarily. Hekana records your store's visits and events itself. And if you have a Facebook or TikTok pixel, there's a screen to connect them.
Ready to start your store?
Start your store now — free, no credit card
- No credit card
- Set up in minutes
- Arabic support team